

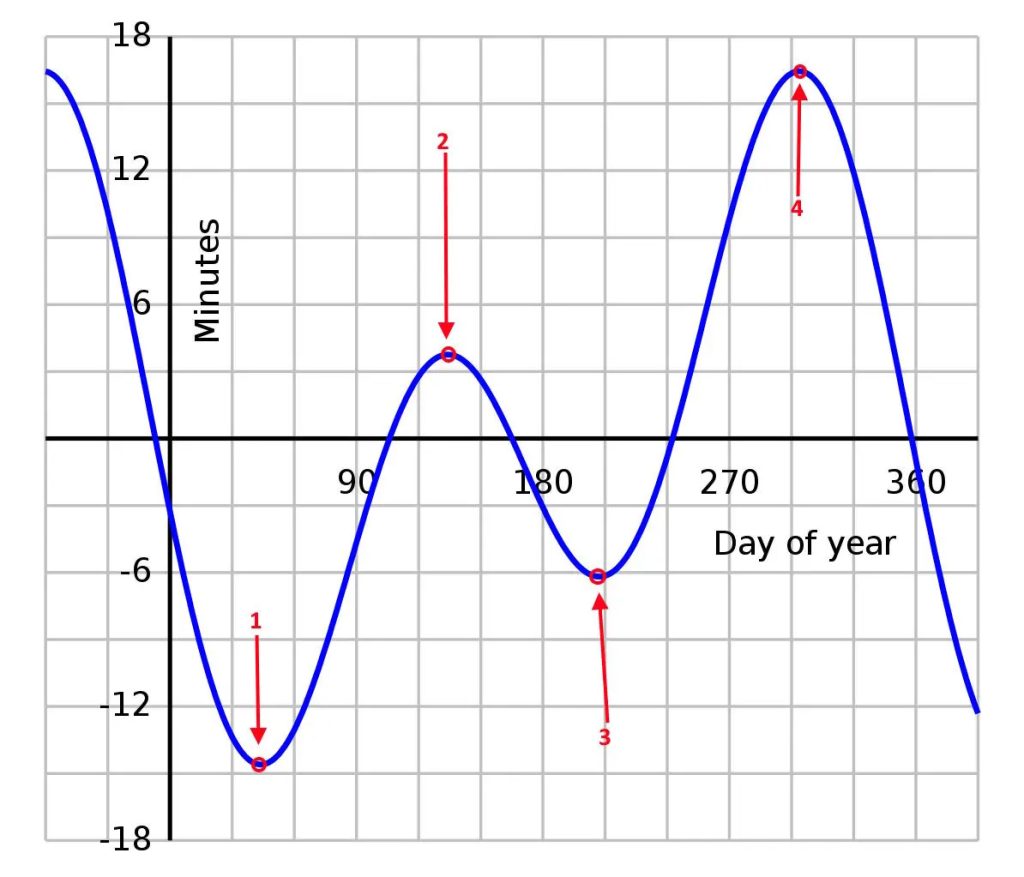
This graph shows the equation of time for a specific location on Earth. Where the slope of the graph is positive, days are shortening; where the slope is negative, days are lengthening; where the slope is zero (at the four locations marked), the day is precisely 24 hours. This happens four times per year in a latitude-dependent fashion.
This graph shows the equation of time for a specific location on Earth. Where the slope of the graph is positive, days are shortening; where the slope is negative, days are lengthening; where the slope is zero (at the four locations marked), the day is precisely 24 hours. This happens four times per year in a latitude-dependent fashion.